Comparison Chart
Why?
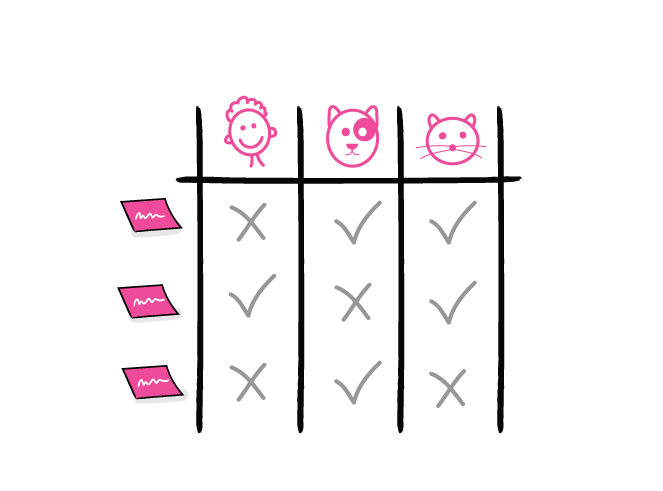
A comparison chart, or comparison table, describes and compares attributes and characteristics of existing products or tools in order to determine the best option for your project.
How?
Use desk research to find or compose a table containing information that compares a number of products or tools. Be sure to determine the priority of the characteristics when making a choice.
Ingrediënts
- A list of attributes and characteristics that is important in the context of your project.
- A list of products to compare, and information on these products.
- A way to determine which attributes and characteristics are most important.
In practice
Comparison charts are often used in comparing and deciding on alternatives when buying (or subscribing to) software used for prototyping or development.